Evaluating binning results
You can use the evaluate subcommand to evaluate your binning results given a ground truth. This evaluation is possible only for simulated or mock metagenomes where the ground truth genomes of contigs are known.
You can run gbintk evaluate --help or gbintk evaluate -h to list the help message for evaluation.
Usage: gbintk evaluate [OPTIONS]

  Evaluate the binning results given a ground truth

Options:
  --binned PATH            path to the .csv file with the initial binning
                           output from an existing tool  [required]
  --groundtruth PATH       path to the .csv file with the ground truth
                           [required]
  --delimiter [comma|tab]  delimiter for input/output results. Supports a
                           comma and a tab.  [default: comma]
  --prefix TEXT            prefix for the output file
  --output PATH            path to the output folder  [required]
  -h, --help               Show this message and exit.
Evaluation Metrics
GraphBin-Tk uses the four common metrics that have been used in previous binning studies.
- Precision
- Recall
- F1-score
- Adjusted Rand Index (ARI)
Please refer to the supplementary material of the GraphBin publication for further details on how to calculate these metrics.
Input Format
The following inputs are required to run the evaluate subcommand.
- A delimited text file containing the ground truth (e.g.
<contig_id>,<groud_truth_bin>in.csvformat) - A delimited text file containing the binning result (e.g.
<contig_id>,<bin_number>in.csvformat)
Example Usage
# Using the `Sim-20G` dataset assembled using metaSPAdes (available on Zenodo)
gbintk evaluate --binned Sim-20G/graphbin_output.csv --groundtruth Sim-20G/ground_truth.csv --output Sim-20G/evaluate_results
Output
You will get a file named evaluation_results.txt that contains the $K \times S$ matrix and the calculated evaluation metrics.
Note: Make sure that the binning result consists of contigs belonging to only one bin. The evaluation metrics consider contigs which belong to only one bin. Please refer to the GraphBin2 publication for details on metrics used to evaluate multi-labelled contigs.
Plotting Evaluation Results
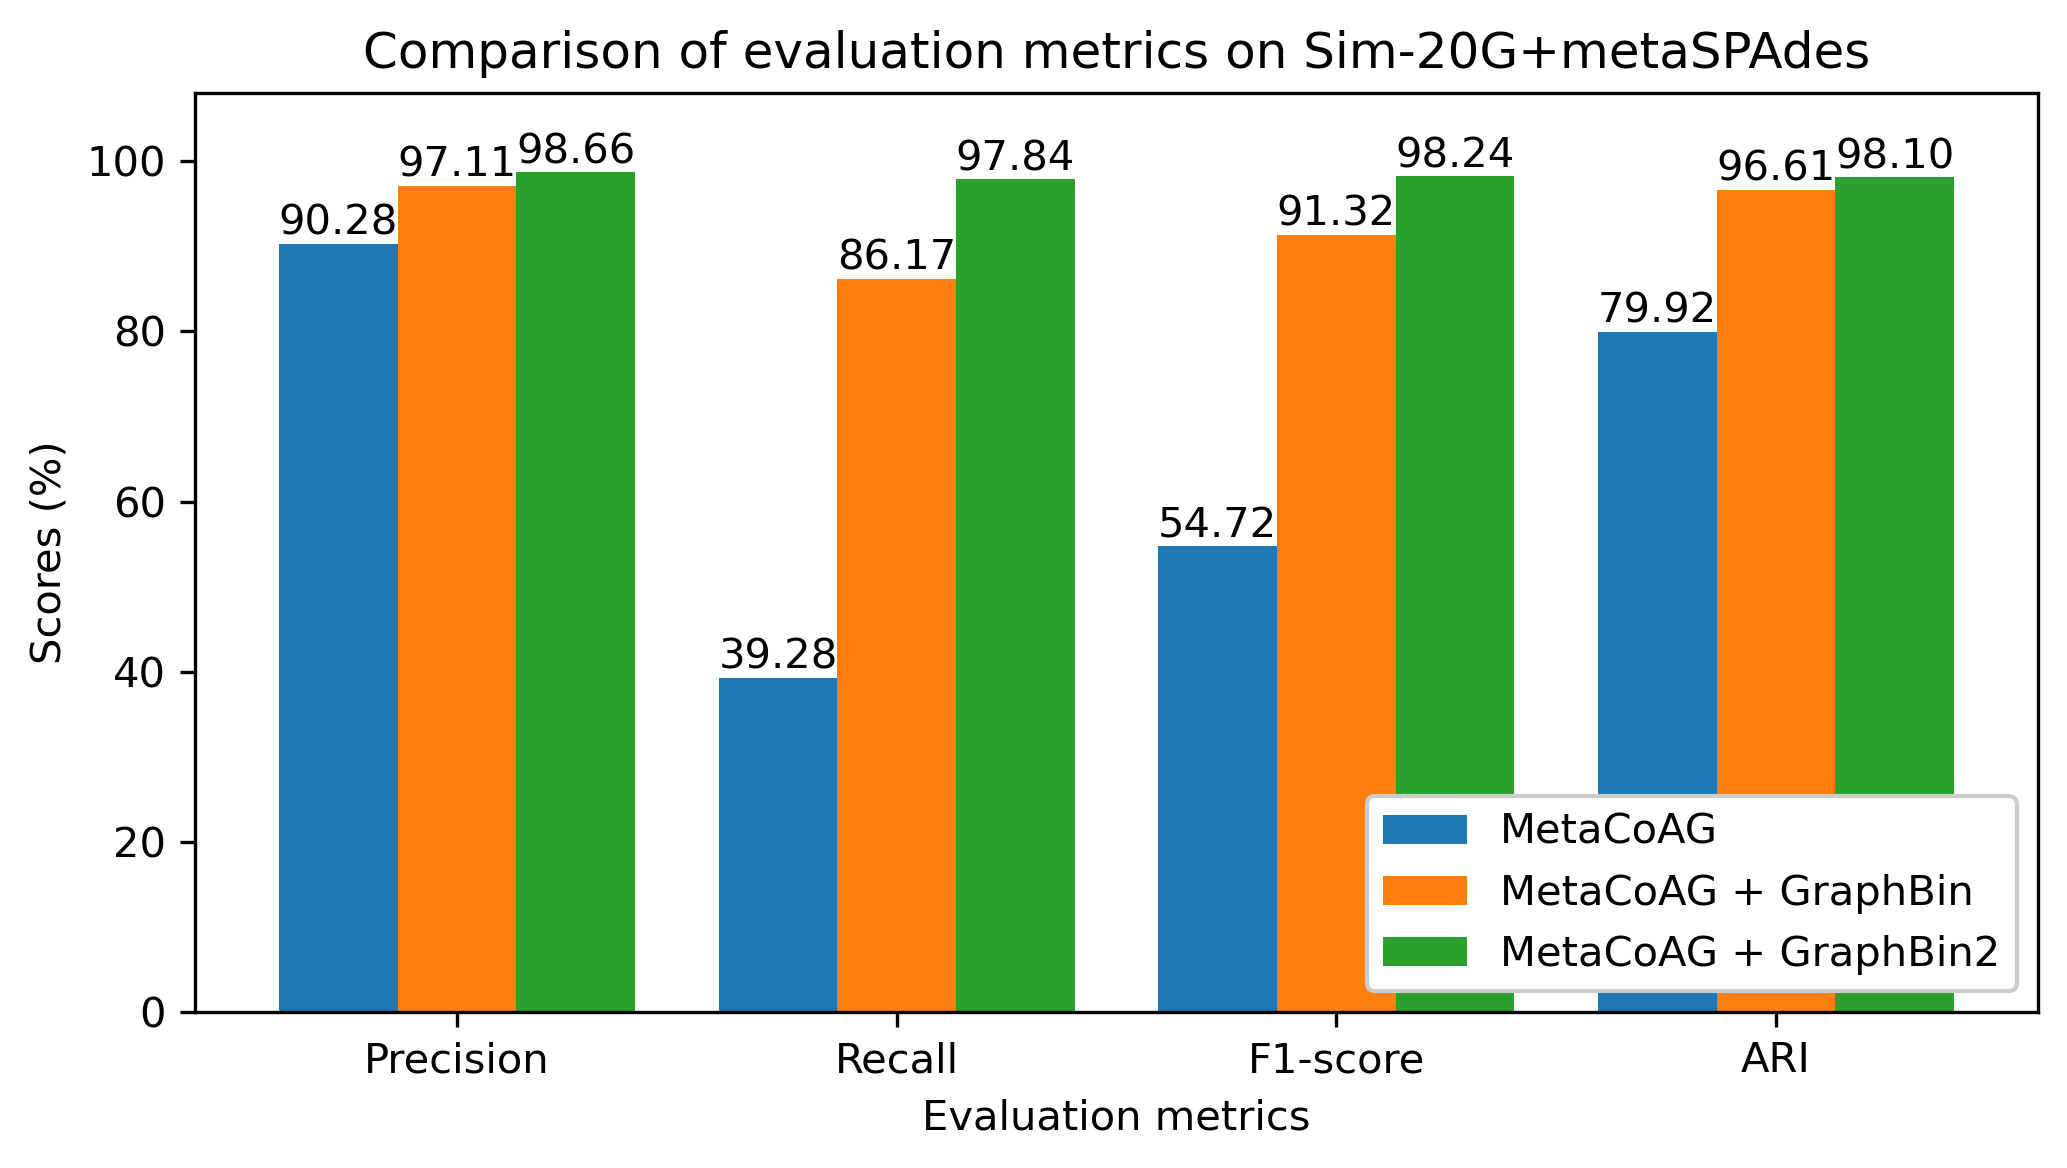
You can use the evaluation results calculated for an initial binning result and a refined binning result to plot and compare. Following is an example code using the results obtained for the Sim-20G dataset assembled using metaSPAdes.
import matplotlib.pyplot as plt
import numpy as np

metrics = ("Precision", "Recall", "F1-score", "ARI")

tools_means = {
    'MetaCoAG': (90.28, 39.28, 54.72, 79.92),
    'MetaCoAG + GraphBin': (97.11, 86.17, 91.32, 96.61),
    'MetaCoAG + GraphBin2': (98.66, 97.84, 98.24, 98.10),
}

# Prepare the data
tool_names = list(tools_means.keys())
tool_data = list(tools_means.values())
n_metrics = len(metrics)
n_tools = len(tool_names)

# X-axis values
indices = np.arange(n_metrics)  # the label locations
bar_width = 0.27  # the width of the bars

# Plotting
fig, ax = plt.subplots(figsize=(7, 4))  # Adjust the figure size here (width, height)

for i, (tool_name, tool_scores) in enumerate(tools_means.items()):
    bars = ax.bar(indices + i * bar_width, tool_scores, bar_width, label=tool_name)

    # Adding annotations on top of bars
    for bar in bars:
        yval = bar.get_height()
        ax.text(bar.get_x() + bar.get_width() / 2, yval, f'{yval:.2f}',
                ha='center', va='bottom', fontsize=10)

# Add some text for labels, title and custom x-axis tick labels, etc.
ax.set_xlabel('Evaluation metrics')
ax.set_ylabel('Scores (%)')
ax.set_title('Comparison of evaluation metrics on Sim-20G+metaSPAdes')
ax.set_xticks(indices + bar_width)
ax.set_xticklabels(metrics)
ax.set_ylim(0, 108)
ax.legend(loc="lower right", framealpha=1)

# Show the plot
plt.tight_layout()
plt.savefig("gbintk_metrics_comparison.png", dpi=300)